The History of Pop/Rock ???55-74
 DB_Cooper
Manhatin' 7,823 Posts
DB_Cooper
Manhatin' 7,823 Posts
Some of you may dig this. There's a gentleman named Edward R. Tufte whose life's work is mastering the art of representing complex systems of data in easy-to-understand visual representations. In one of his books, he uses a hand-drawn graph of "marketing trends and stylistic patterns in the development of pop/rock music" from 1955-1974 as an exemplar. It's extremely dense, but I find it fascinating.It looks like this: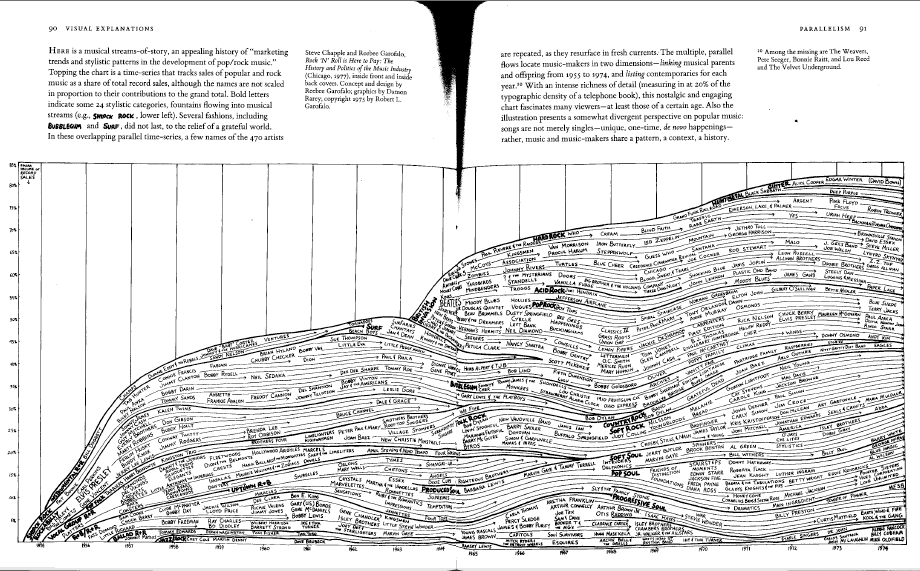 You can download a .pdf I made of the graph to zoom in on it.Enjoy.
You can download a .pdf I made of the graph to zoom in on it.Enjoy.
Comments
could be read in conjunction with Pete Frame's rock family trees of Zigzag fame
btw are there any funk/soul/jazz versions of these?
Not in that book, but it was used merely as an example???from what I understand, he didn't actually create the graph. I'll see what I can find.
thanks for the PDF
I am trying to imagine how many times the guy must have redrafted the flow.
Blown up, it would make a great wallpaper/mural for a long room. I'm going to ponder that for my next DIY project.
Here's the bottom left of the graph: